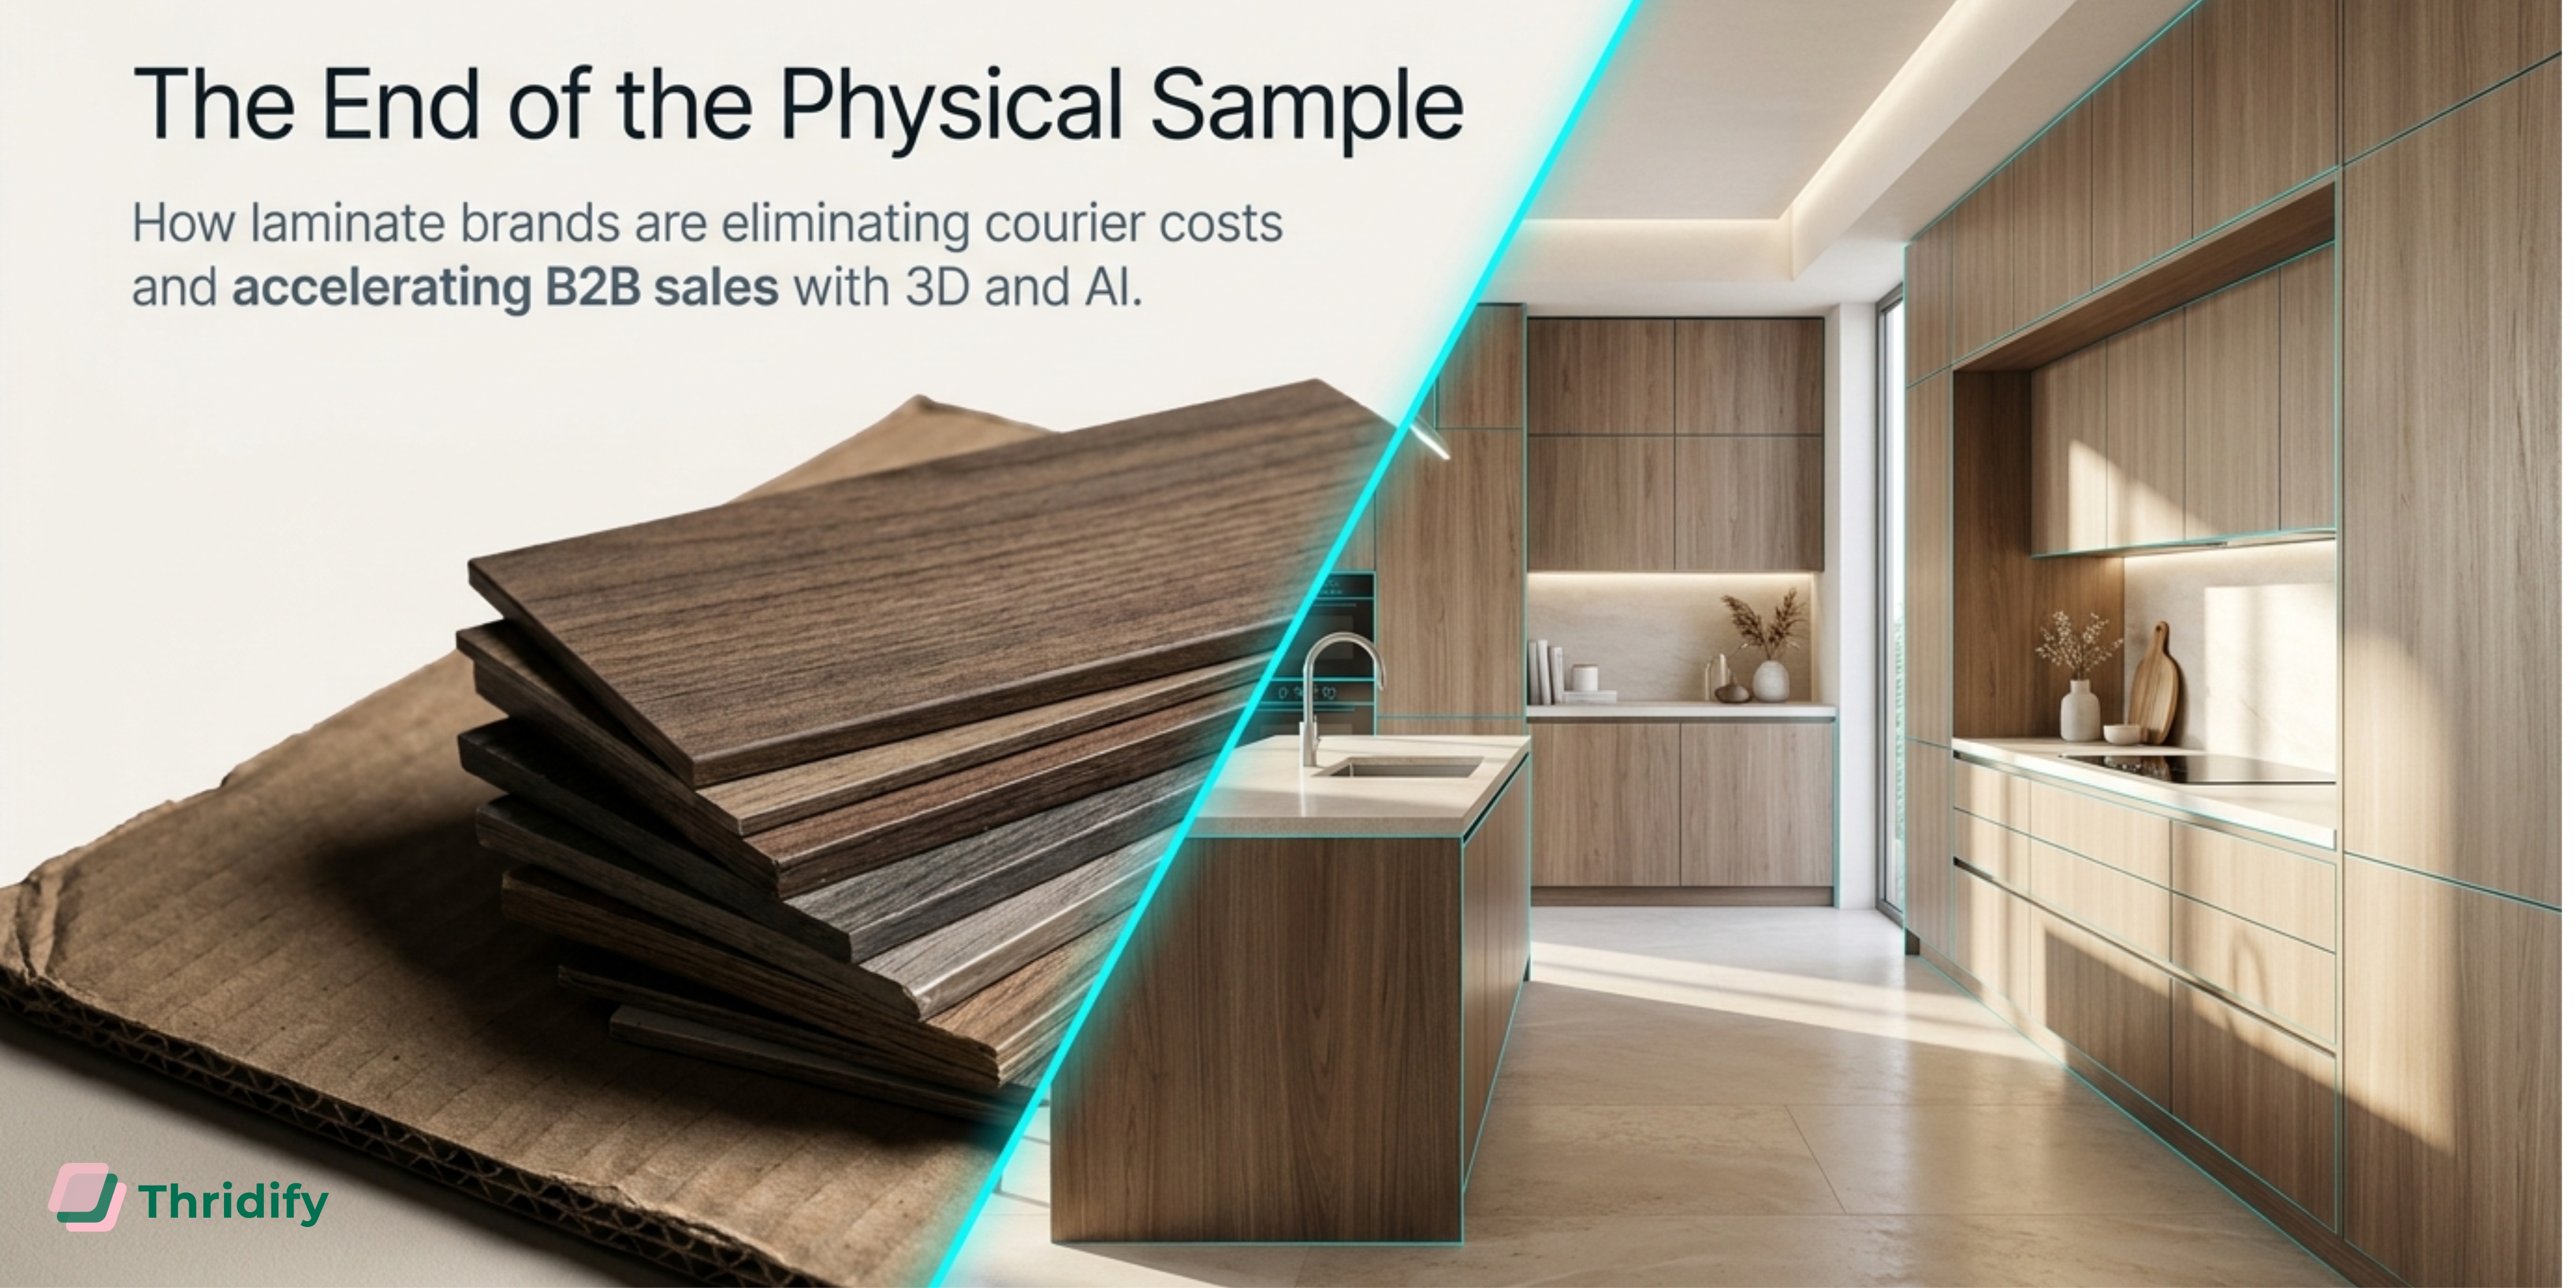
Rajesh builds modular kitchens in Ahmedabad. His showroom displays twelve kitchen configurations. His website shows flat photographs of the same twelve. Last quarter, he lost three orders worth Rs 18 lakh — not because his kitchens were inferior, but because a competitor let customers drag-and-drop cabinet modules on a screen and see the price update in real time. Rajesh’s customers couldn’t visualize what their Rs 5 lakh kitchen would actually look like installed. His competitor’s customers could.
This isn’t a story about one kitchen manufacturer falling behind. It’s a signal. And it’s one of five converging signals that 3D commerce — the use of interactive 3D models, product configurators, and augmented reality in online and offline selling — has crossed from “nice-to-have innovation” to “critical business infrastructure” in 2026.
Here are the five signals, backed by data, that explain why.
Signal 1: The Market Just Crossed $10 Billion — and Nobody Noticed
The 3D e-commerce market grew from $8.53 billion in 2025 to $10.54 billion in 2026, a 23.6% compound annual growth rate. It is projected to reach $24.37 billion by 2030.
Let those numbers settle. A market doesn’t grow at 23.6% annually because a handful of early adopters are experimenting. It grows that fast because enterprise buyers, mid-market brands, and entire supply chains are shifting purchasing behaviour.
But the headline number masks what is really happening underneath.
The proof is in the details. One 3D commerce startup focused on footwear grew from 160,000 to 2.3 million monthly user interactions in one year — a 14x increase. Configurator platforms now have published case studies across verticals as diverse as shutters, glass, electronics, and drinkware. Major furniture retailers including Macy’s, Ashley Furniture, La-Z-Boy, and Kingfisher have all invested in 3D product visualization for their online stores.
The broader 3D and 4D technology market hit $225.88 billion in 2026, growing toward $536.99 billion by 2035. Roughly 62% of retail and e-commerce platforms now use some form of 3D product visualization.
What does this mean for a brand selling furniture, kitchens, doors, or home decor online? The brands you compete with are already investing in this. The ones that have not started are about to. The window for being an early mover is closing. The window for being left behind is opening.
What Thridify sees: Our clients in furniture and modular kitchens report that the shift from flat product pages to interactive 3D configurators compresses their sales cycle by up to 3X. The technology is no longer the bottleneck — the bottleneck is brands that have not yet made the switch.
Signal 2: AI Shopping Agents Now Need 3D Product Data to Function
This is the signal most brands are not paying attention to, and it may be the most consequential.
In 2026, three major protocols were launched to enable AI agents to shop on behalf of consumers:
- Google’s Universal Commerce Protocol (UCP), co-developed with Shopify, Etsy, Wayfair, Target, and Walmart, and endorsed by Amazon, Meta, Microsoft, Stripe, Visa, and Mastercard.
- OpenAI and Stripe’s Agentic Commerce Protocol (ACP), live inside ChatGPT since September 2025.
- The Machine Payments Protocol (MPP), launched March 2026 with over 100 integrated services.
These are not experimental projects. UCP was announced at the National Retail Federation’s Big Show in January 2026. Amazon, Meta, Microsoft, and Salesforce joined the UCP Tech Council in April 2026. ChatGPT now processes roughly 50 million shopping-related queries every day — about 2% of all its queries.
Here is why this matters for 3D commerce: AI shopping agents work by reading structured product data — descriptions, specifications, prices, images, and increasingly, 3D models. An agent asked to “find a modular bookshelf that fits in a 180cm x 60cm space and show me how it looks in my living room” needs spatial product data. Flat JPEG images cannot answer that query. A 3D model with accurate dimensions can.
The traffic data backs this up. AI-driven traffic to U.S. retail sites rose 393% year over year in Q1 2026. AI-referred visitors convert at 12.3% versus 3.1% for non-AI traffic — roughly 4X better. Morgan Stanley forecasts that 50% of online shoppers will use AI agents by 2030.
Brands without structured 3D product data will not just miss out on a marketing channel. They will be invisible to the AI agents increasingly doing the shopping.
What this means practically: If your product catalog consists of flat photographs and text descriptions, an AI agent asked “show me a modular kitchen in my space” will skip you entirely and recommend a competitor whose product has 3D model data. This is not hypothetical — it is how UCP and ACP are designed to work.
Signal 3: 92% of Gen Z Wants AR When They Shop — and They’re Becoming the Primary Buyers
Here is a data point that should stop every e-commerce brand manager mid-scroll: 92% of Gen Z consumers prefer to use augmented reality when purchasing products online.
Not “are aware of AR.” Not “find AR interesting.” Ninety-two percent actively prefer it as part of their buying process.
The breakdown by category is even more striking. Gen Z AR preference by product category: 94% for furniture and home decor, 92% for clothing, shoes, and accessories, 91% for paint, and 90% for makeup and hair products. Meanwhile, 71% of Gen Z consumers already use AR to preview products before buying, and 60% say AR makes shopping feel more personal.
This is not a niche preference. Gen Z is 2.56 billion people globally. They are entering their peak earning and spending years. Their purchasing behaviour is not a trend that will fade — it is the new baseline expectation.
AR user penetration across all demographics hit 54.9% in 2026, meaning more than half of internet users now encounter AR regularly. And 63% of global retail brands already leverage AR for virtual product displays.
What happens when a generation that expects AR shopping encounters a furniture brand with a static image gallery and a “request a quote” button? They leave. They find someone who lets them place the product in their room.
The furniture-specific reality: Furniture has the highest Gen Z AR preference at 94%. This is logical — furniture is expensive, hard to return, and impossible to judge from a photograph alone. A Rs 4 lakh modular kitchen is not an impulse purchase. The customer needs to see it in their space. AR is not a feature for furniture brands. It is table stakes.
Signal 4: The Return Rate Crisis Has a 3D Solution — and the Math Now Proves It
Every year, the e-commerce industry treats returns as a cost of doing business. In 2025, U.S. retail returns alone hit $849.9 billion. Globally, e-commerce returns exceed $640 billion annually.
Furniture and home decor sit at the painful intersection of high return rates and high return costs. The average e-commerce return rate is 19-20.5%, but furniture-specific returns run at 15-22.7%. The cost per furniture return? Between $55 and $90 for processing alone — and a full furniture return involving freight, inspection, and potential write-off can cost $100-$200 per item.
For a furniture brand doing Rs 10 crore in annual revenue with a 20% return rate, that is Rs 2 crore in returned goods. Processing those returns at even Rs 5,000 per item eats directly into margin. For many mid-market brands, returns are the difference between profitability and loss.
Now here is where 3D product visualization changes the equation.
Brands deploying 3D product pages report an average 40% reduction in return rates, according to multiple industry studies. Some brands report reductions of up to 70%. The mechanism is straightforward: the number one reason for furniture returns is size mismatch — customers cannot judge dimensions from flat photographs. AR spatial placement shows the product at exact scale in the customer’s actual room. When customers can see that the sofa fits before ordering, they stop returning sofas that do not fit.
The conversion side is equally compelling. Products with 3D or AR content see 94% higher conversion rates than those with standard images only. Shoppers who interact with a 3D model show 64% higher purchase intent. Retailers implementing virtual try-on report a 30% increase in sales conversions alongside 30% fewer returns.
The return on investment math has tipped. For a furniture brand losing Rs 2 crore annually to returns, a 40% reduction saves Rs 80 lakh. Pair that with even a modest conversion uplift, and the ROI timeline compresses to weeks, not years. Thridify clients typically break even within 4-6 weeks and achieve 300%+ ROI by month six.
The shift: Five years ago, 3D product visualization was a “nice-to-have” that might reduce returns. In 2026, the data is unambiguous. It is the single most effective tool available for reducing return-driven losses while simultaneously increasing conversions. The brands not using it are subsidizing their returns problem with margin.
Signal 5: The Exhibition Industry Is Going 3D — and Bridging the Physical-Digital Gap
Walk the floor of any major trade show in India — HGH India, ACETECH, INDEX Plus, the Indian Houseware Show — and you will see a pattern. Hundreds of brands invest lakhs in booth design, product displays, and four days of intense selling. Then the exhibition ends, the booth comes down, and those beautifully displayed products go back to being flat photographs on a website.
This is the physical-digital gap, and it is one of the most wasteful patterns in B2B and D2C commerce.
A brand spends Rs 5-15 lakh on an exhibition booth that operates for four days. The same brand could invest a fraction of that amount in a 3D product configurator that operates 365 days a year, reaching customers who will never visit a physical showroom.
The exhibition industry itself is recognizing this shift. The spatial computing retail market reached $11.26 billion in 2026. Interactive showroom experiences — where visitors can configure products, see pricing in real time, and visualize products in their own spaces — are replacing static displays.
For furniture, kitchen, and home decor brands that rely on exhibitions for lead generation, the calculus is changing. The exhibition remains valuable for relationship-building and tactile product experience. But the 3D digital showroom extends that experience to the 99% of potential customers who were not at the booth.
What the smart brands are doing: They are using exhibitions as a launchpad for their 3D presence — scanning products at the booth, creating 3D models during the event, and launching interactive configurators within weeks. The exhibition becomes the content engine, not just a four-day sales sprint.
What These Five Signals Mean Together
Each of these signals is significant on its own. Together, they describe a tipping point.
The market has crossed $10 billion and is growing at 23.6%. AI shopping agents are being built by Google, OpenAI, Amazon, and Stripe — and they need 3D product data to function. The largest emerging generation of buyers actively prefers AR-enabled shopping, especially for furniture and home decor. The return rate crisis now has a proven, data-backed 3D solution with clear ROI. And the exhibition industry that drives B2B sales is merging with digital 3D experiences.
This is not a prediction. This is what is already happening.
The question for every brand selling visually complex, high-consideration products — furniture, modular kitchens, doors and windows, home decor, office systems — is no longer “should we invest in 3D commerce?” The question is “how quickly can we get there before our competitors do?”
Frequently Asked Questions
What is 3D commerce?
3D commerce refers to the use of interactive 3D product models, product configurators, and augmented reality (AR) experiences in the buying and selling process. It allows customers to view products from every angle, customize options in real time, see live pricing, and place products in their real environment using AR — all without downloading an app. 3D commerce platforms like Thridify provide these capabilities as a SaaS solution that integrates with existing e-commerce websites via a lightweight plugin.
How big is the 3D commerce market in 2026?
The global 3D e-commerce market reached $10.54 billion in 2026, growing at a 23.6% compound annual growth rate (CAGR) from $8.53 billion in 2025. It is projected to reach $24.37 billion by 2030. The broader 3D and 4D technology market is valued at $225.88 billion in 2026.
How does 3D product visualization reduce returns?
3D product visualization reduces returns by eliminating the “imagination gap” — the difference between how a product looks in a photograph and how it looks in the customer’s real environment. AR features let customers place furniture, kitchens, and home decor items in their actual rooms at exact scale, resolving the size mismatch that causes 22-40% of furniture returns. Brands using 3D product pages report an average 40% reduction in return rates.
What is agentic commerce and why does it matter for 3D?
Agentic commerce is a model where AI agents (like ChatGPT, Google Gemini, or other AI assistants) shop on behalf of consumers. Major protocols like Google’s Universal Commerce Protocol (UCP) and OpenAI’s Agentic Commerce Protocol (ACP) enable AI agents to browse product catalogs, compare options, and complete purchases. These agents need structured product data — including 3D models and spatial specifications — to function effectively. Brands without 3D product data risk being invisible to AI shopping agents.
Do Gen Z consumers actually prefer AR shopping?
Yes. According to 2026 research, 92% of Gen Z consumers prefer to use AR when purchasing products online. The preference is highest for furniture and home decor (94%), followed by clothing (92%), paint (91%), and beauty products (90%). Additionally, 71% of Gen Z already use AR to preview products before buying.
How much does a 3D product configurator cost?
Costs vary significantly depending on the platform and scope. Enterprise solutions from legacy vendors can cost $50,000 or more annually. Mid-market SaaS platforms like Thridify offer subscription-based pricing that makes 3D configurators accessible to brands with 20-500 employees, with ROI typically achieved within 4-6 weeks. The investment should be compared against the cost of product returns and lost conversions from static product pages.
Can I add 3D and AR to my website without coding?
Yes. Modern 3D commerce platforms offer no-code integration via lightweight plugins or embeddable code snippets. Thridify, for example, integrates with Shopify, WooCommerce, WordPress, and custom websites without requiring any technical expertise or app installation. Customers can view 3D models and access AR try-on features directly in their browser using WebAR technology.
What industries benefit most from 3D commerce?
Industries selling visually complex, high-consideration, and often customizable products benefit most. This includes furniture and home decor, modular kitchens, wardrobes, custom doors and windows, office systems, prefab structures, laminates and surfaces, architectural hardware, luxury sanitaryware, premium cycles, and educational publishing (AR-enabled books and learning materials). Any product where the buyer needs to “see” the product properly before committing to a high-ticket purchase is a strong fit.
How does 3D commerce improve conversion rates?
Products featuring 3D or AR content see an average 94% higher conversion rate compared to standard product images. Shoppers who interact with a 3D model show 64% higher purchase intent. This improvement comes from increased buyer confidence — when customers can rotate, zoom, customize, and place products in their environment, they make faster purchasing decisions with fewer doubts.
Is 3D commerce only for large enterprises?
No. While early 3D commerce adoption was driven by large global retailers, the technology has become accessible to mid-market brands. Platforms like Thridify are specifically designed for brands with 20-500 employees, offering SaaS subscriptions that eliminate the need for large upfront investment. The key question is not company size but whether your products are visually complex and high-consideration enough to benefit from interactive 3D presentation.
Thridify is India’s first comprehensive SaaS-based, no-code 3D and AR visual commerce platform. We help furniture, kitchen, and home decor brands sell better with interactive 3D configurators, AR try-on, and real-time pricing — all without coding or app downloads. Book a demo to see how 3D commerce can work for your brand.